Turn Instagram Insights Into Fans: A Musician’s 90 Day Playbook
Instagram Insights shows you three things that actually matter for a music career: who is discovering you, what makes them stop scrolling, and whether they take a real step toward becoming a fan. For musicians, that means prioritizing Reels reach to non-followers, profile visits, and link clicks over your follower count. Open your last Reel’s reach breakdown and your weekly profile visits right now, then pick one variable to test this week.
TL;DR:
- Reels reach to non-followers and link clicks are more predictive of discovery and fan conversion than follower count or impressions.
- Native Insights caps most metrics at 90 days, so exporting or screenshotting data regularly is essential for long-term comparison.
- Excluding outliers when calculating engagement rates provides a clearer picture of typical audience interaction levels.
- Reels with native Instagram audio, engaging opens, and vertical framing outperform other formats in discovery metrics.
- Weekly and monthly routines combining tactical checks and strategy reviews help turn insights into actionable growth decisions.
Table of Contents
- What Are Instagram Insights for Musicians and How Do You Access Them?
- Which Metrics Actually Matter for Music Promotion?
- Why Do Reels Matter So Much for Musician Discovery?
- What Do Story Metrics Tell You About Fan Engagement?
- How Do You Read Audience Demographics and Find the Best Posting Times?
- When Should You Use Third-Party Analytics Tools?
- How Do You Turn Instagram Insights Into Real Decisions?
- What’s a Realistic Weekly and Monthly Insights Routine?
- Why Combine Instagram Insights With Streaming and Ad Data?
- A Musician’s Perspective on Letting Data Guide the Work
- Turn Your Insights Into a Working Growth System
- Sources
- FAQ
What Are Instagram Insights for Musicians and How Do You Access Them?
Instagram Insights only works on Professional accounts, so if you’re still on a personal profile, that’s step one. Go to your profile, tap the menu icon, select Settings and Privacy, then Account Type and Tools, and switch to either a Creator or Business account. Both give you full analytics access; Creator accounts tend to suit solo artists and bands better because they skip some of the retail-focused features Business accounts include.
Once you’re set up, Insights lives in a few different places depending on what you want to check:
- Overview dashboard: tap the menu icon on your profile, then “Insights,” for a rolled-up view of accounts reached, engaged, and total followers.
- Post-level data: tap “View Insights” directly under any published post or Reel.
- Story-level data: swipe up on an active Story, or check “Insights” under expired Stories within the 24-hour window.
- Content you shared: filter by content type (posts, Reels, Stories, Lives) to compare performance side by side.
Here’s the catch most musicians miss: native Insights caps most metrics at roughly a 90-day data window, and Live videos drop off even faster, often within 30 days. If you want to compare this quarter’s release cycle to last year’s, you need to export or screenshot your numbers before they age out. There’s no built-in historical export button, so a simple monthly screenshot habit (more on that later) saves you from losing your own data.
Which Metrics Actually Matter for Music Promotion?
Not every number in your Insights dashboard deserves your attention. Some tell you whether people are finding you. Others tell you whether they’re becoming fans. Knowing the difference is the whole game.
Here’s how the core metrics break down:
- Reach counts unique accounts that saw your content at least once. If your last single announcement reached 8,000 accounts but only 1,200 follow you, that’s a discovery win worth studying.
- Impressions counts total views, including repeats. A high impressions-to-reach ratio can mean people are rewatching a Reel, which is a strong signal for a music video teaser or a live-session clip.
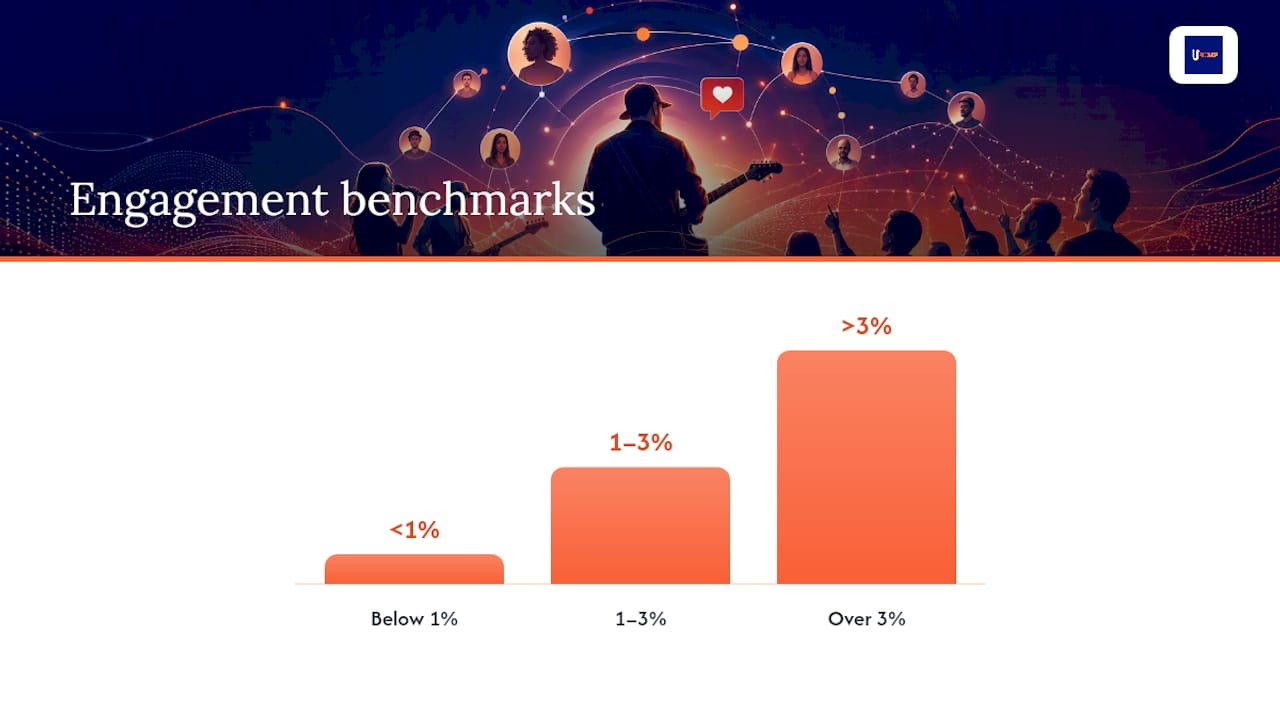
- Engagement rate measures likes, comments, saves, and shares divided by reach or followers. For musicians, 1 to 3 percent is typical, and anything above 3 percent counts as strong.
- Saves signal future intent. A fan saving a 15-second clip of your chorus is telling you they plan to come back, maybe to learn the words before your next show.
- Shares measure word-of-mouth. Someone sending your song preview to a group chat is a far stronger endorsement than a like.
- Profile visits show curiosity. Someone watched something and wanted to know more about who made it.
- Link clicks are your hardest conversion signal, whether that’s a pre-save link, ticket page, or merch drop.
Statistic Callout: Music accounts typically see 1 to 3 percent engagement as a healthy baseline, with anything over 3 percent considered strong for the genre. If your numbers sit below 1 percent consistently, the problem is usually content format, not audience size.
There’s one calculation trick almost nobody does correctly: recompute your engagement rate excluding your single most viral post. If one Reel went unusually big because of a trending sound or a lucky algorithm push, it can make your average look far healthier than your typical output actually performs. Pull that outlier, run the math again, and you’ll see your real baseline. A steep drop after removing it tells you your growth leaned on luck rather than a consistent connection with your audience.
Think of it this way: reach and impressions are your discovery signals, telling you whether new people are finding your music. Saves, shares, profile visits, and link clicks are your conversion signals, telling you whether those new people are moving toward becoming fans, streamers, or ticket buyers. Track both, but weight your decisions toward conversion when release season hits.
Why Do Reels Matter So Much for Musician Discovery?
Reels are the closest thing Instagram has to a discovery engine, and for musicians, they function as the front door to your entire catalog. Reels reach far beyond your existing followers in a way feed posts rarely do anymore, which makes Reels metrics worth checking before almost anything else in your dashboard.
The Reels-specific numbers to watch:
- Plays: total views, a rough gauge of raw exposure.
- Reach to non-followers: the percentage of viewers who don’t already follow you, your clearest discovery metric.
- Completion rate: how many people watched to the end, which the algorithm reads as a quality signal.
- Saves and shares: stronger intent signals than plays alone, especially for song-preview content.
A few creative levers move these numbers more than people expect. Using native Instagram audio (even a clip of your own track uploaded as an “original sound”) tends to outperform music added after the fact through the built-in music library. Your opening three seconds matter more than your production budget. Vertical framing that fills the whole screen keeps people from scrolling past. And a simple caption CTA like “which lyric hits hardest?” nudges comments that boost your completion signal.
Pro Tip: Run small, single-variable tests instead of guessing. Post the same clip with two different opening three seconds, or swap in a different sound over identical footage, and compare reach-to-non-followers after 48 hours. One changed variable per test is what actually tells you what worked. If you need format inspiration to fuel these tests, ready-to-shoot Reels ideas built for musicians can shortcut the brainstorming.

What Do Story Metrics Tell You About Fan Engagement?
Stories work differently than Reels. They’re not built for discovery, they’re built for depth with the fans who already know you. The metrics reflect that:
- Views: raw exposure among people who already engage with your account.
- Exits: how many people left the Story sequence at that specific frame, a signal something didn’t hold attention.
- Replies: direct messages sent in response, your strongest one-to-one engagement signal.
- Link taps: clicks on a swipe-up or link sticker, critical for pre-saves and ticket countdowns.
- Sticker interactions: polls, quizzes, and question boxes that measure active participation.
Stories shine for specific fan-facing use cases: a pre-save countdown building toward release day, a ticket on-sale reminder with a link sticker, or a rapid-fire Q&A using the question sticker after a show. If you notice a spike in exits at a particular frame, that’s usually a pacing problem. Too much text, a slow build, or an ask that comes before you’ve earned it. A jump in replies, on the other hand, tells you that frame resonated enough for someone to type a response instead of just tapping through.
How Do You Read Audience Demographics and Find the Best Posting Times?
Your audience tab, found inside the main Insights dashboard, breaks followers down by age range, gender, top cities, and countries. It also shows when your followers are most active, hour by hour and day by day. This is where Instagram analytics for musicians stops being about vanity numbers and starts informing actual decisions: when to post, where to tour, and where to spend ad dollars.
Run a real test instead of guessing at “best times.” Pick two posting windows, say 6 PM and 9 PM in your audience’s dominant time zone, and alternate between them for two to three weeks. Track reach and engagement rate for each window separately. Whichever window consistently outperforms becomes your control going forward, and you re-test again in three to six months since audience behavior shifts with algorithm changes.
Top-city data deserves more attention than most musicians give it. If your Insights show unexpectedly strong concentrations in cities you haven’t toured, that’s a real signal worth testing with a small geo-targeted ad or a set list teaser aimed at that market before committing to a full routing decision.
| Insights data point | Where to find it | Primary use |
|---|---|---|
| Age range | Audience tab | Tailoring tone and platform choice |
| Top cities | Audience tab | Tour routing and local ad targeting |
| Active hours | Audience tab | Posting time tests |
| Follower growth trend | Overview dashboard | Detecting real growth vs. viral spikes |
For a deeper strategic read on why this data matters beyond the dashboard itself, audience data’s role in career growth is worth a closer look.
When Should You Use Third-Party Analytics Tools?
Native Insights is free and good enough for weekly tactical checks, but it has real limits. The 90-day window means you can’t easily compare this year’s album cycle to last year’s without manual tracking, and there’s no built-in way to track hashtag performance or specific audio trends across your account.
Meta Business Suite sits one step up. It’s still free, and it consolidates Instagram and Facebook data with slightly better scheduling and reporting than the native app, though it doesn’t extend your historical window much further.
Third-party tools add real value once you outgrow those limits, specifically through longer historical trend charts, scheduled reports you can send to a manager or label partner, hashtag and audio tracking, and multi-user team access if you’re not managing the account solo.
Before paying for anything, run through this checklist:
- Do you need more than 90 days of history for release-cycle comparisons?
- Do you need to send recurring reports to a manager, booking agent, or label?
- Do you need hashtag or trending-audio tracking beyond what’s native?
- Do multiple team members need account access without sharing a password?
If you answered yes to two or more, a paid tool earns its cost. If not, native Insights checked on a consistent cadence covers you fine.
How Do You Turn Instagram Insights Into Real Decisions?
Data without a decision framework is just a dashboard you check out of anxiety. Use a simple loop instead:
- Signal: Notice a pattern, like Reels consistently outperforming static posts in reach to non-followers.
- Hypothesis: Form a specific guess, such as “posting two Reels a week instead of one will grow discovery reach by a measurable margin.”
- Test: Run it for two to three weeks, changing only that one variable.
- Evaluate: Compare reach, saves, and profile visits before and after, then decide whether to keep, adjust, or drop the change.
Real examples make this concrete. If Reels reach to non-followers climbs while feed-post reach stays flat, increase Reels cadence and hold feed posts steady. If profile visits spike after a Story link sticker but link clicks stay low, your call to action needs to be clearer, not your traffic. If a 15-second song-preview Reel outperforms everything else you posted that month, repurpose it as a Story highlight, a paid ad creative, or the opening clip in your next Reel.
Pro Tip: Test only one variable at a time and give it two to three weeks. A small batch of three to six targeted posts testing a single idea beats scattering your attention across every metric on every post.
Conversion signals like link clicks are also how you attribute real marketing outcomes. If you ran a paid ad pointing to a pre-save link and link clicks jumped without a matching spike in organic reach, that’s the ad working, not your content suddenly improving. For more on connecting these dots to longer release planning, see data-driven decision-making for indie artists.
What’s a Realistic Weekly and Monthly Insights Routine?
Checking analytics constantly burns time you should spend making music. Checking them never means you’re flying blind. The recommended cadence is weekly for tactical adjustments and monthly for strategic review.
Weekly (15 to 20 minutes):
- Identify your top-performing post or Reel and note what made it different.
- Check your engagement rate against your established baseline.
- Reply to your top five comments, since replies boost future reach on that post.
- Note results from any active single-variable test.
Monthly (30 to 45 minutes):
- Compare your content mix (Reels versus feed posts versus Stories) against what actually performed.
- Review your follower growth curve and flag any spikes tied to a specific post or press mention.
- Recompute your baseline engagement rate excluding your top outlier post.
- Set one realistic benchmark to beat next month, based on your own history rather than someone else’s viral numbers.
Why Combine Instagram Insights With Streaming and Ad Data?
Instagram Insights tells you half the story. The other half lives in your streaming numbers and ad performance, and combining social data with streaming metrics is standard practice for artists serious about tracking real conversion paths, not just vanity engagement.
A practical workflow looks like this:
- Pull your top-engaging audience segments from Instagram and build lookalike audiences for paid campaigns.
- Run targeted ads pointing to a pre-save or streaming link, then track link clicks against actual stream lift.
- Cross-reference which cities show high Instagram engagement against where your streaming numbers are also climbing.
- Feed all of it into one dashboard instead of tab-switching between four apps during a release week.
This is exactly the gap tools like UpNComer’s Data Analyst and Growth Engine modules are built to close, connecting the social signal to the streaming outcome without manual spreadsheet work.
A Musician’s Perspective on Letting Data Guide the Work
Data doesn’t write your next song, and it shouldn’t try to. What Insights actually gives you is a faster feedback loop than waiting for a booking agent’s gut feeling or a fan’s random comment months later. The musicians who improve fastest treat every post as a small, disposable test rather than a precious creative statement they’re afraid to touch. Run the experiment, read the number, keep what worked, and let the rest go. Your instincts pick the sound. The metrics just tell you whether anyone’s actually listening for it.
— Karan
Turn Your Insights Into a Working Growth System
Checking Instagram Insights every week is a habit worth building, but a habit only pays off when the data connects to what happens next: your release calendar, your ad spend, and your distribution timeline. Some platforms link your Instagram audience signals directly to campaign tools, so a spike in Reels reach or profile visits can trigger an actual next step instead of sitting in a screenshot folder.
Instead of bouncing between your Instagram dashboard, an ad manager, and a separate distribution portal, UpNComer keeps audience data, ad campaigns, and release planning inside one workspace. If you’re also weighing where to release your next single, Music Distribution runs on a straightforward royalty split with no subscription fee attached. For the full platform, UpNComer Pro is $27 per month or $300 per year. Check the pricing page today and see which plan fits your next release cycle.
Sources
- Instagram Analytics For Musicians: Top Tools & Metrics | iMusician
- The essential Instagram metrics to track | Sprout Social
FAQ
What Is the 5-3-1 Rule for Instagram?
The 5-3-1 rule is a content-mix guideline: for every nine posts, share five pieces from others in your niche, create three original posts of your own, and post one direct promotional piece. Musicians can adapt it by swapping “others in your niche” for fan-generated content, behind-the-scenes clips, and collaborator posts, keeping direct promotion to a small share of total output.
What Can Instagram Insights Show You?
Instagram Insights shows reach, impressions, engagement rate, saves, shares, profile visits, and link clicks for posts, Reels, and Stories, typically covering up to a 90-day window. It also breaks down your audience by age, location, and active hours, which helps musicians time posts and plan tours around where fans actually are.
What Are Good Instagram Bio Ideas for Musicians?
A strong musician bio names your genre or sound in plain words, includes one clear call to action (stream, tickets, pre-save), and uses a single link tool pointing to your most important current destination. Keep it short enough to scan in two seconds, since most profile visitors decide whether to explore further almost instantly.
Who Are Gen Z’s Favorite Musicians?
Gen Z listening habits shift quickly and vary heavily by platform and region, so there’s no single fixed answer that holds for long. Instead of chasing broad generational trends, your own Insights audience tab is the more reliable source: check your actual followers’ age range and top cities to understand who’s engaging with your music right now.
How Often Should Musicians Check Instagram Insights?
A weekly check for tactical adjustments and a monthly review for strategy works well for most independent musicians, based on recommended industry cadence. Checking more often than that rarely changes decisions and tends to eat into time better spent creating.